learn · internet 101
internet 101
A concise primer on internet performance, packet transport, radio spectrum, and satellite access, written for engineers, operators, and investors, and for anyone learning more, including space nerds.
it just works
Most of the time, the internet simply works. You open a page, join a call, or pull a map, and the answer arrives. That ease is so complete that it is easy to forget how unlikely it is: labeled fragments of data racing across continents on glass, through radios in the air, and sometimes through satellites, then reassembling into something you can read or hear in a fraction of a second.
This page is a short tour of that machine. The goal is appreciation with precision: enough structure to talk about performance, paths, spectrum, and orbit without losing the sense that the everyday miracle is worth noticing.
performance metrics
When the network is healthy, you rarely think about it. When something feels off, three quantities usually explain why: uptime, latency, and throughput. A hydraulic analogy is useful for keeping them distinct.
uptime
Available time fraction
Open the valve: is water present, or is the line dry? Uptime is the fraction of time the connection is available.
uptime = (hours connected ÷ hours in the period) × 100%
Example: 23.5 connected hours in a 24-hour day → 23.5 ÷ 24 = 97.9%.
- typical range: ~99%–99.9% for healthy residential fixed service over a quiet month.
- good: 99.9%+ (under ~45 minutes of outage in a 30-day month).
- common: high 99%s on capable fixed broadband; mobile and remote links vary more widely.
- degraded: repeated multi-hour outages, or sustained performance below ~99%.
- near-term outlook: additional path diversity, including LEO backup, should lift more sites toward steady 99.9%-class availability.
latency
Round-trip delay
Open the valve: how long until water starts to flow? That lag is latency, measured in milliseconds (ms).
round-trip time = time out + time back
Example: a probe takes 12 ms to reach a server and 12 ms to return → round-trip time = 24 ms.
- typical range: ~5–40 ms local/regional broadband; ~40–100 ms continental; ~100–200+ ms intercontinental fiber.
- good: under ~50 ms round-trip for interactive voice and gaming; under ~100 ms for most interactive applications.
- common: tens of milliseconds on wired broadband to nearby endpoints; higher for distant servers or wireless last miles.
- degraded: ~150–200 ms becomes noticeable for gaming and some calls; GEO paths often reach hundreds of milliseconds.
- near-term outlook: LEO access in the ~20–60 ms class expands to regions that previously had only high-latency options.
Propagation in fiber is about 2×10⁸ m/s (~⅔ of vacuum c), or roughly 5 µs/km one way. Distance sets a lower bound; queuing and radio add delay above that floor.
throughput
Delivered data rate
Once the valve is open: how much water moves per second? Throughput is data per second actually received or sent (Mbps or Gbps).
throughput = bits delivered ÷ seconds
Example: 125 megabytes in 10 seconds → 100 megabits per second → throughput = 100 Mbps.
Bandwidth is pipe capacity (the design maximum of the link). Throughput is the realized flow rate after contention, wireless conditions, and protocol overhead. Colloquial “speed” almost always means throughput.
- typical range: tens to a few hundred Mbps on many residential plans; 1 Gbps+ on fiber where deployed; lower and more variable on congested cellular.
- good: ~100 Mbps+ for concurrent HD video, calls, and downloads; multi-hundred Mbps or gigabit for headroom.
- common: market-dependent; often ~50–300 Mbps on fixed access in well-served cities.
- degraded: under ~25 Mbps for a busy HD household; under ~10 Mbps for modern multi-user video.
- near-term outlook: wider multi-gig fiber, with LEO capacity rising toward competitive residential rates in more regions.
packets and paths
The internet transports information in packets. Each packet has two principal parts:
- header, addressing and control (destination, session identity, reassembly).
- payload, the data itself (page fragment, media chunk, file segment).
Routers forward packets hop by hop. Segments of one transfer may take different routes and still reassemble correctly at the destination. That quiet reliability, shared paths, labeled units, continuous delivery, is a large part of why the internet feels ordinary even though the choreography is not.
path · device to destination
Each hop contributes delay and can constrain throughput under load. Latency and speed tests measure this end-to-end path.
Excess delay → latency. Insufficient rate → throughput. Intermittent loss of service → uptime. Identify the metric before attributing fault to a technology.
the last mile
Long-haul networks interconnect cities. The last mile is the final segment to a premises, handset, vessel, or office: fiber, cable, DSL, fixed wireless, cellular, or a satellite terminal. Most days it disappears into the background. Most user-visible impairment originates here too, often compounded by local Wi-Fi and busy-hour contention.
spectrum and radio
Wireless links use radio waves, an invisible medium we treat as ordinary because the handset just connects. A wave has a frequency (hertz) and a wavelength. Higher frequency implies shorter wavelength. In vacuum, frequency × wavelength ≈ 3×10⁸ m/s (example: 100 MHz ≈ 3 m; 10 GHz ≈ 3 cm).
Lower frequencies generally propagate farther and penetrate better. Higher frequencies support wider channels and higher throughput under clear path conditions. Regulators allocate bands; transmitters operate within those assignments.
frequency and wavelength · sender to receiver
Dots sit on wave crests (one symbol sample per cycle in this simplified picture). The traveling bead follows the wave; the receiver light flashes once per crest. The top path has 4 cycles; the bottom path has 8 at twice the frequency, so it registers bits twice as often in the same transit time.
The endpoints are not magnets flipping a light switch. At the sender, electronics drive an oscillating current in an antenna. Those accelerating charges radiate an electromagnetic wave (linked electric and magnetic fields traveling together). At the receiver, that wave induces a tiny oscillating voltage in another antenna. Amplifiers clean it up, and a detector samples the waveform, often near each cycle or symbol, and decides 0 or 1. Higher frequency means more of those sample opportunities per second, which is why (with a clear path and enough channel width) more bits can be delivered in the same time.
channels
Analog broadcast is a useful parallel: a receiver tunes to a frequency. AM encodes information in amplitude; FM encodes it in frequency deviation. Data networks partition spectrum into channels so many transmitters can share the medium without mutual interference. Wi-Fi access points, handsets, and satellite terminals operate on assigned channels under that regime.
satellite access
Satellite connectivity is still packet internet, with one remarkable difference: part of the path leaves the planet. A user terminal transmits to a satellite; traffic returns to a ground gateway (optionally via one inter-satellite hop), then continues on terrestrial fiber into a data center and the broader network. Done well, even that can feel like the network simply working.
Orbit altitude and shared spectrum bound latency and throughput. Evaluate any system with the same three metrics: uptime, latency, and throughput.


how satellite internet works
Read left to right and up: the user dish sends on RF fronthaul (often Ku-band) to a Starlink satellite in LEO. The satellite returns traffic on RF backhaul (often Ka-band) to a gateway ground station. From there, fiber carries packets into a data center. An optional laser ISL can move traffic to another satellite before the downlink. Peers in the same altitude class include Amazon Leo (ex-Kuiper) and Eutelsat OneWeb; GEO is compared in the table below.
LEO and GEO
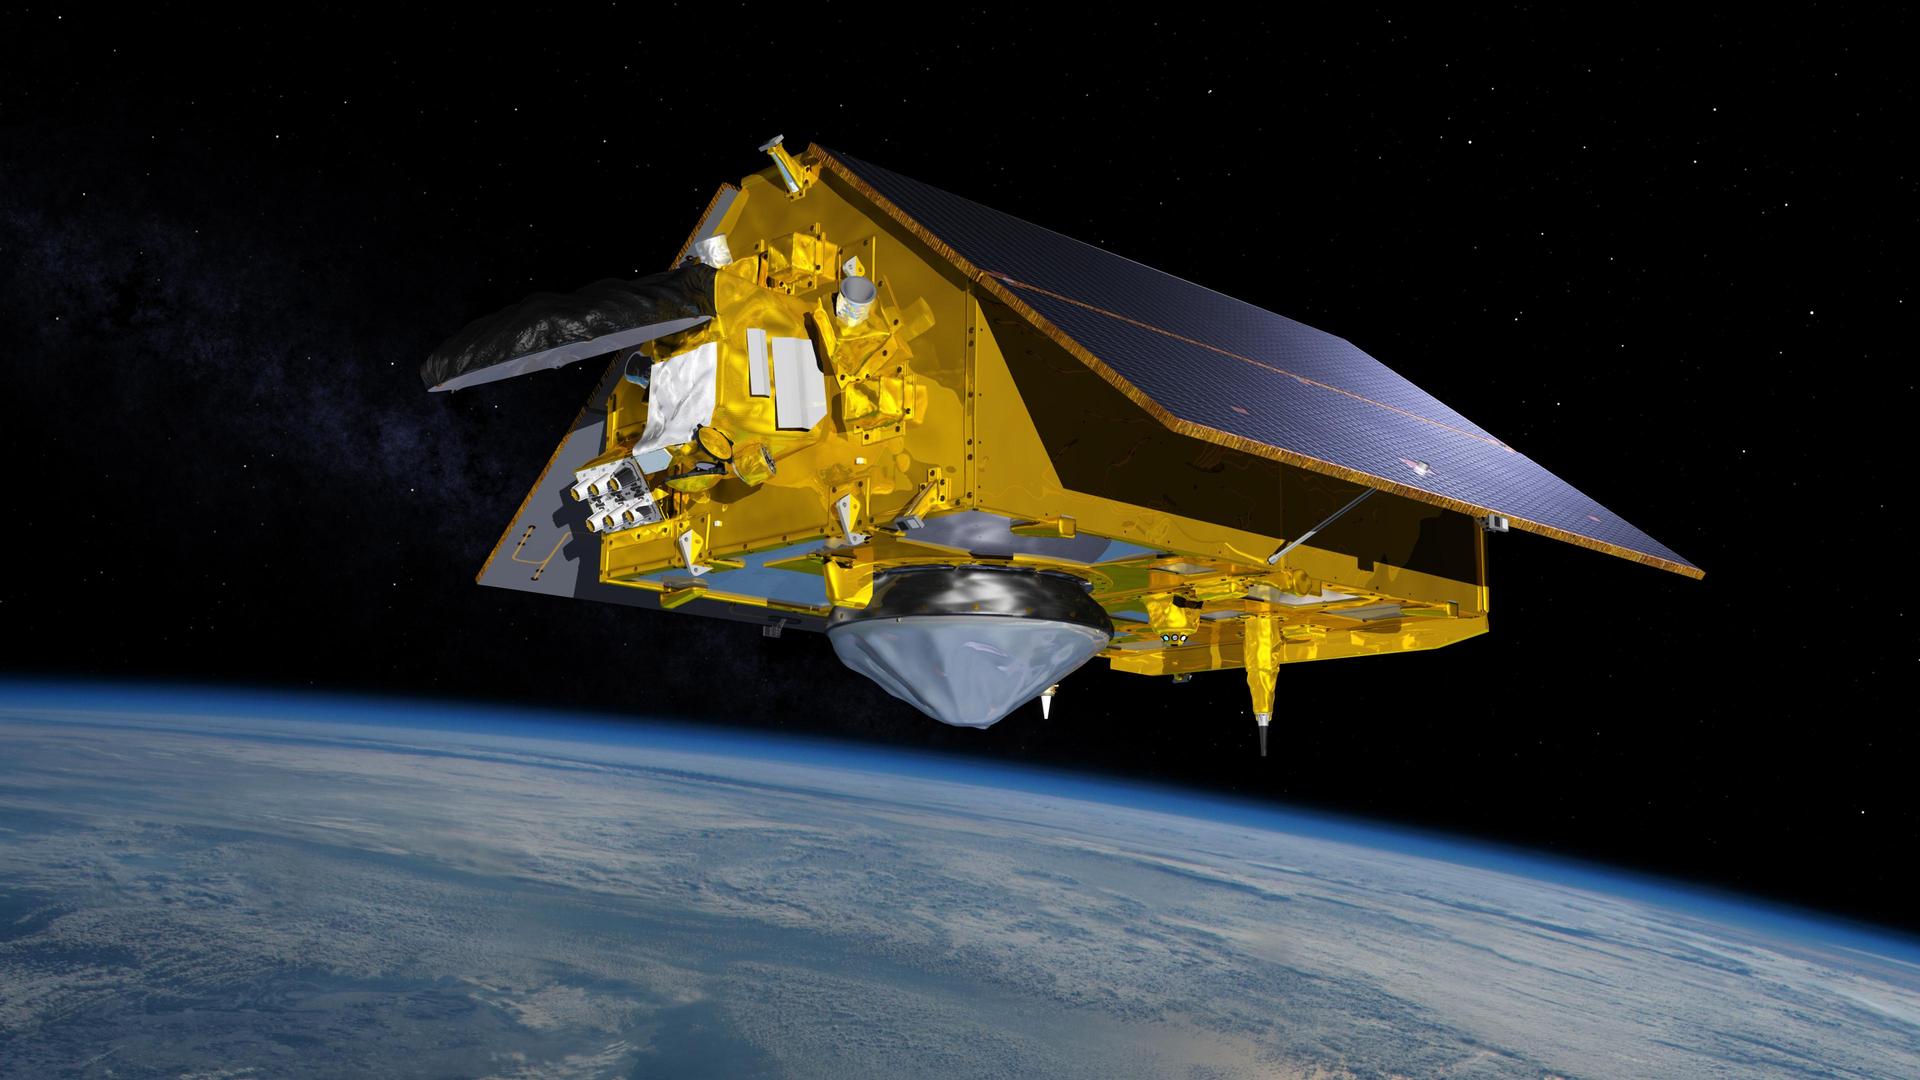
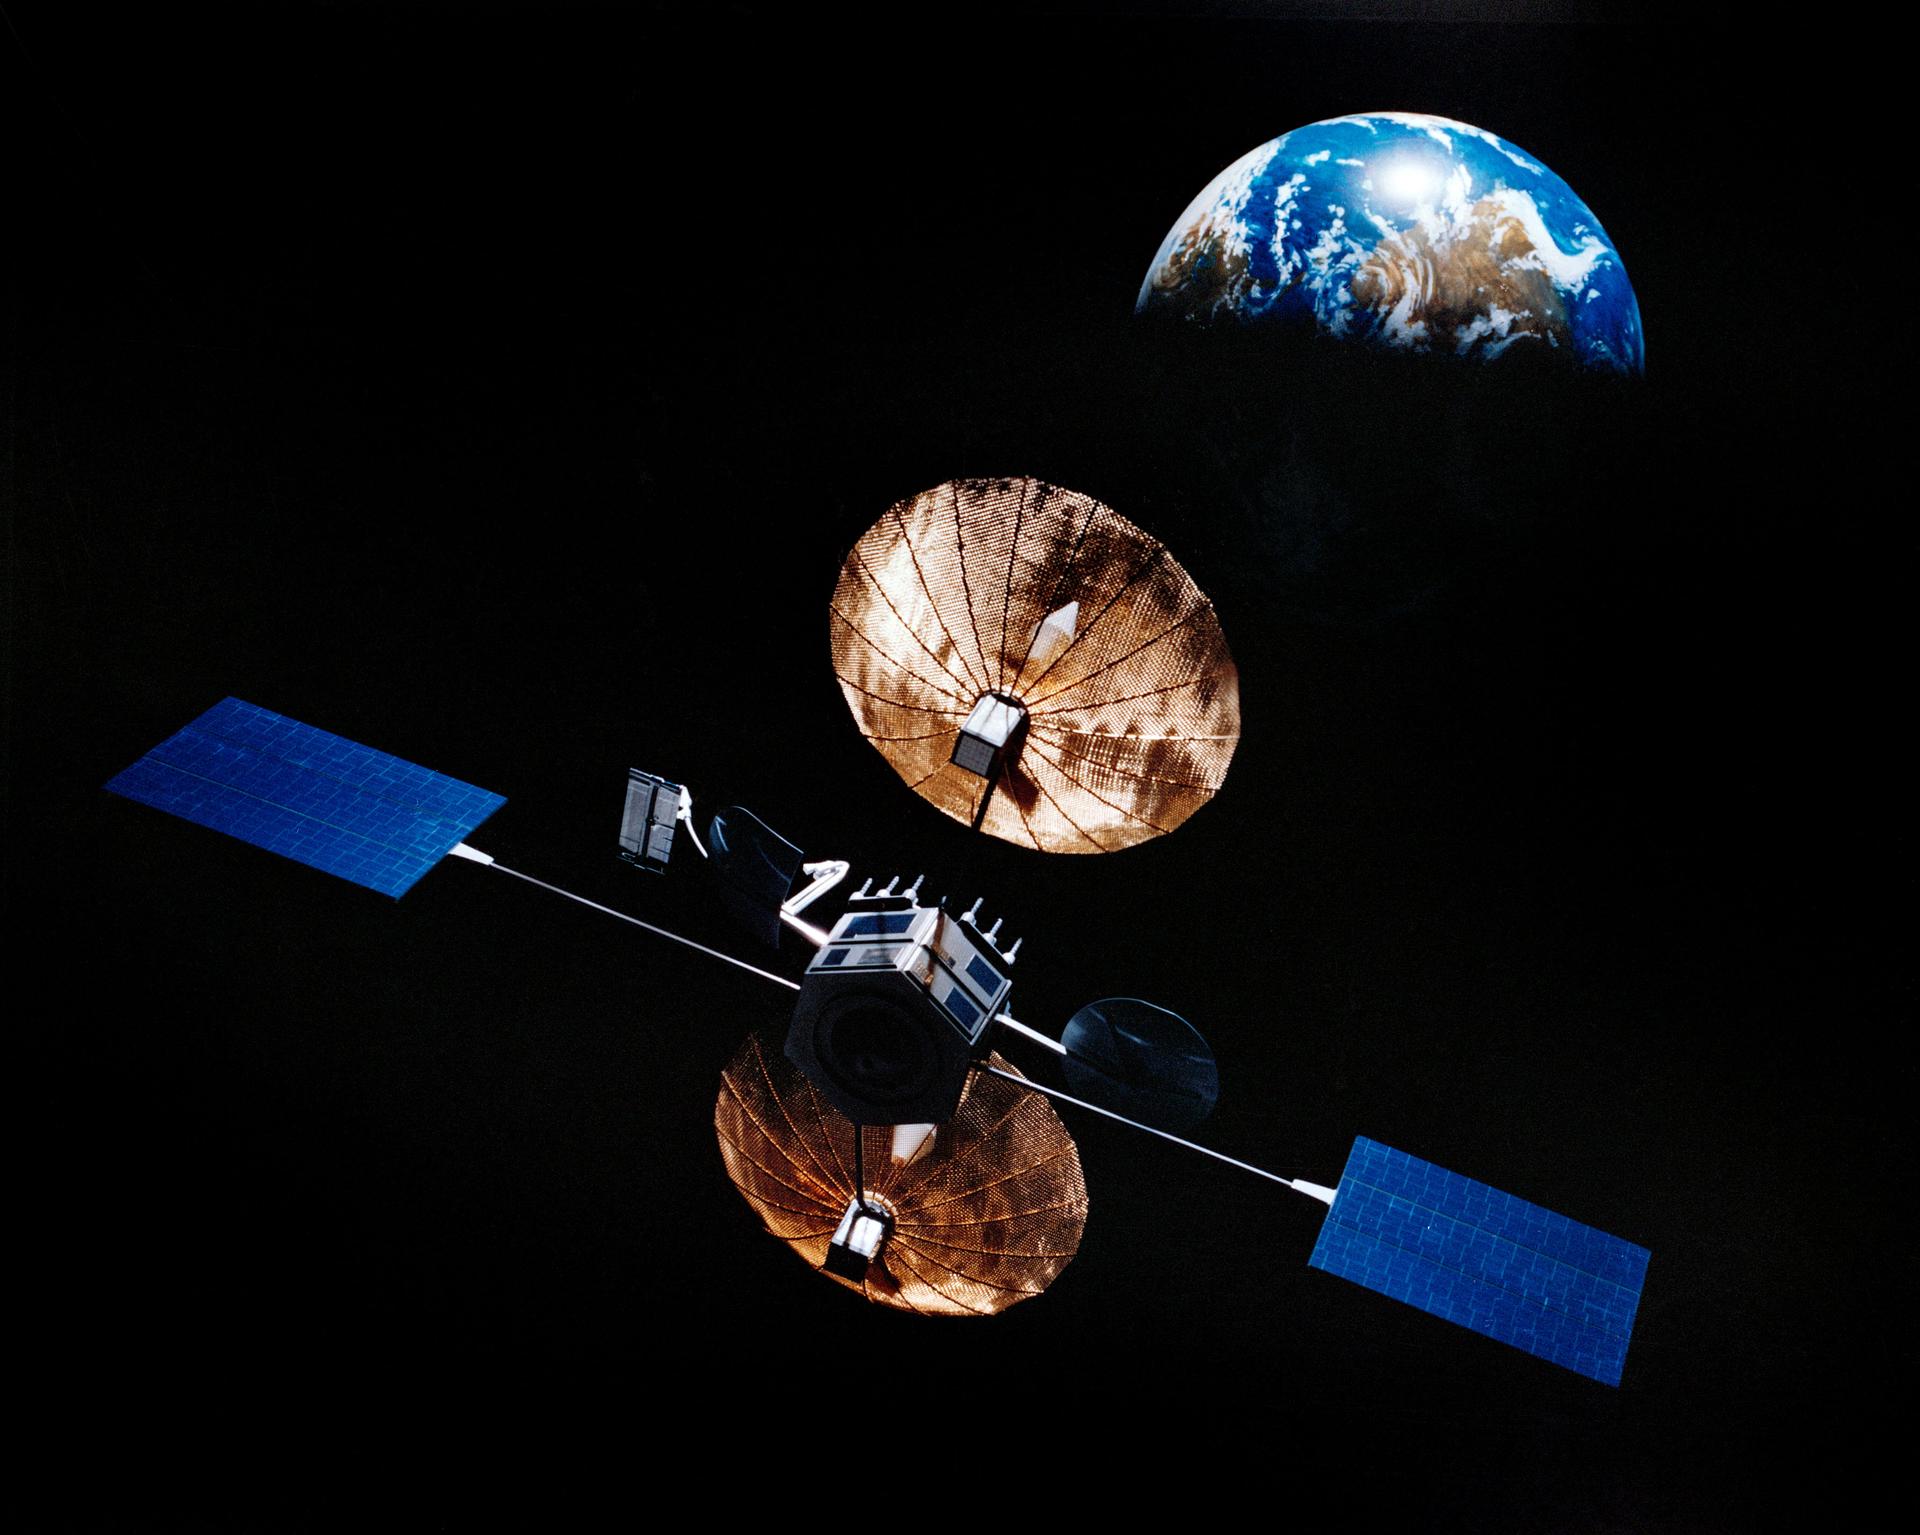
Two orbit regimes dominate satellite broadband discussion. On LEO: Starlink at consumer scale, with Amazon Leo (ex-Kuiper) and Eutelsat OneWeb as the peers most often compared in BAA work. On GEO: established broadband operators in the Viasat / Hughes class.
| LEO | GEO | |
|---|---|---|
| altitude | ~500–2,000 km | 35,786 km |
| one-way light time | ~1.7–6.7 ms | ~119 ms |
| user latency class | ~20–60 ms round-trip on a healthy end-to-end path | typically hundreds of ms round-trip |
| coverage model | large constellation, frequent handoffs | few satellites, wide footprints |
| primary advantage | lower interactive delay | simple wide-area coverage |
Medium Earth orbit (MEO) lies between them. Compare systems on uptime, latency, and throughput under stated busy-hour assumptions.
summary
- Uptime = availability. Latency = delay (round-trip time). Throughput = delivered data rate. Bandwidth = link capacity; throughput = realized flow.
- Packets = header + payload, forwarded hop by hop, often on different routes, still arriving as one experience.
- Last-mile and busy-hour conditions dominate most user-visible impairment; when they are quiet, the miracle stays invisible.
- Spectrum is partitioned into channels; frequency and wavelength are inverse under c.
- Satellite access adds an orbital radio segment that returns via gateway toward a data center on terrestrial networks. LEO is near; GEO is far; altitude dominates delay.
- Notice the machine when you can. Most of the time it just works, and that is worth appreciating.